We have an eclectic mix of inputs by Visual Analytics experts coupled with plenty of time for practical learning sessions.
Keynote sessions
Keynote sessions are inputs by practitioners / researchers in the area and will include time for questions / interaction.
Practice Session
In practice sessions you will be guided through a Visual Analytics case study. This will be a hands-on practical session.
Networking Session & team working sessions
On Monday you will have the opportunity to meet everyone and form ‘teams of common interest’. These teams will work on a challenge throughout the week and present their findings on the last day of the Summer School.
Tools and demonstrations
There is no set tool / software for the duration of the course so you can use whichever tool / software you are most familiar with. There will be formal sessions on Tableau and Siren. These and other tools will be used in the practice sessions.
Day-to-day breakdown
Monday June 10th
9.30am: OfficialWelcome by Dr Paul Buitelaar, Vice-director of the Data Science Institute.
9.45am: Introduction to Visual Analytics by Dr Alex Endert.
Visual Analytic tools help people make sense of data. This talk will introduce core concepts, cover design principles, and showcase existing tools via demos.
12noon: Networking Session
This is time set aside to find out about the other participants and to form teams.
Tuesday June 11th
9.30am How to make an impact with Visual Analytics? by Ciaran Flynn (Tableau Dublin)
In this session we will be covering the importance of visual analytics when working with Data. Why?, you might say… What a great question… We will also be diving into the power of the question WHY?
Tools used:
- Tableau Desktop – Client Application
- Tableau Server – Browser Based Experience
- Tableau Prep Builder – Extract Transform Load Application for data prep
2pm: Using Siren. By Giovanni Tummarello (CPO of Siren)
Siren is an investigative intelligence platform. For difficult industry problems in which traditional BI is useful, but not enough.
Wednesday June 12th
9.30am: Big Data Mining by Andy Donald
Many data scientists & data visualisation experts encounter major difficulties in managing their data in order to make sense of it – In particular within large datasets. In this session, we will look at ways in which data can be mined more efficiently covering:
- Typical problems associated with mining data for data visualisation
- Tools to help with efficient data mining (Apache Spark)
- Practical demonstration using distributed data mining
11.30am: Critical Thinking in Visual Analytics: An Information Systems Development Perspective by Dr Noel Carroll
In this session we will look at the following:
- A background on Critical Thinking
- An insight on our current research on Agile Software Transformation and the importance of visualisation
- Examine the role of Critical Thinking to ask the right questions in Visual Analytics
- Guideline on employing Critical Thinking standards in research
Thursday June 13th
9.30am: Metrics, Dashboards and Data Visualization by Sean O’Riain, Fidelity Investments
Visual simplicity helps direct focus to what really matters. Irrespective of audience data visualizations that remove clutter and complexity while incorporating intuitive interaction will ensure that the data needed to move forward is there. This talk explores these topics within the context of metric dashboards.
11.30am: Human Sensemaking and Visual Analytics by Karen Young
This talk will explore the potential for well designed Visual Analytic tools to support humans in making sense of data. Key topics covered include:
- Sensemaking: How do we make sense of the world? (Incorporates a consideration of ambiguity, complexity, collective experience, shared awareness and connections)
- What really matters: Exploring what matters to users and why
- What to support: What human activities to support at the User Interface
- Interaction Design: How to design to support intuitive interaction and exploration with visual analytics
Friday June 14th
9.30am: Team presentations
This day will be given over to teams presenting their findings from their working sessions.
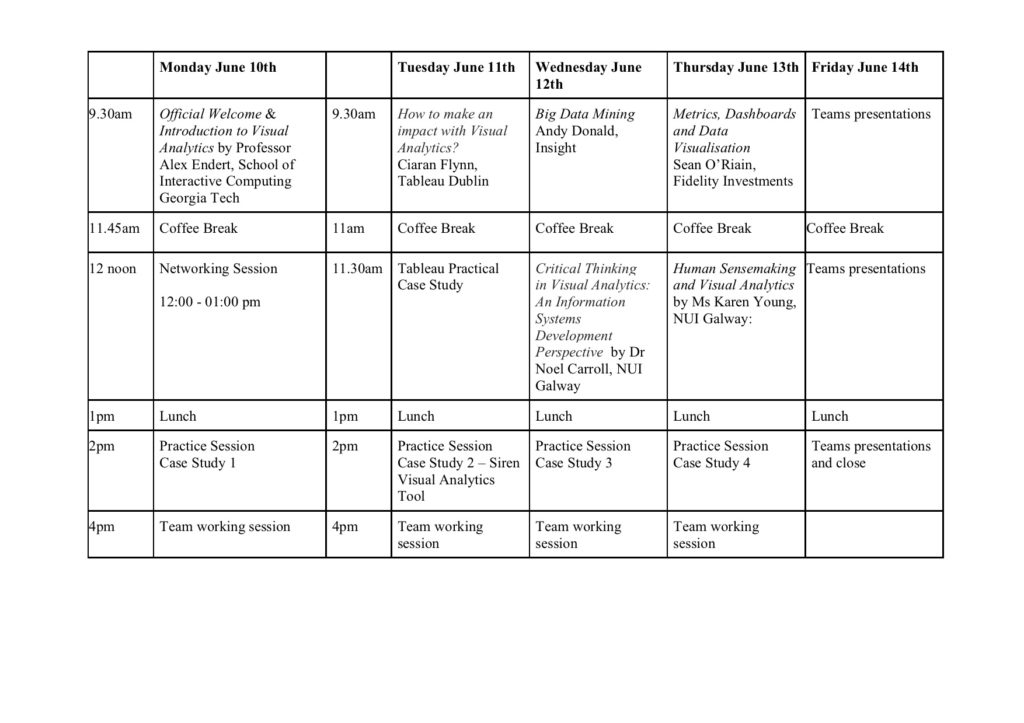
Programme overview at a glance
Speakers
The following section will be updated as more speaker bio’s become available.
Alex Endert

Alex Endert is an Assistant Professor in the School of Interactive Computing at Georgia Tech. He directs the Visual Analytics Lab, where he and his students explore novel user interaction techniques for visual analytics. His lab often applies this fundamental research to domains including text analysis, intelligence analysis, cyber security, decision-making, and others. He is an active contributor to venues for human-computer interaction and information visualization (ACM CHI, IEEE VIS, IEEE TVCG). His lab receives generous support from sponsors including NSF, DOD, DHS, DARPA, DOE, and industry. In 2018, he received a CAREER award from the National Science Foundation for his work on visual analytics by demonstration. He received his Ph.D. in Computer Science from Virginia Tech in 2012, advised by Dr. Chris North. In 2013, his work on Semantic Interaction was awarded the IEEE VGTC VPG Pioneers Group Doctoral Dissertation Award, and the Virginia Tech Computer Science Best Dissertation Award.
Website: http://va.gatech.edu/endert/
Noel Carroll
Noel Carroll is a Lecturer in Business Information Systems and Researcher with Lero – the Irish Software Research Centre at the National University of Ireland, Galway. He received his PhD (Computer Science) from the University of Limerick in 2012. His research interests include seeking ways to support organisations in developing digital transformation strategies. He has edited special issues, published, chaired, and reviewed for leading international journals and conferences in his field.
Karen Young
Karen Young is a lecturer in Information Technology at NUI, Galway. Her research interests are concerned with the effective collaboration of human and digital agents and sit at the intersection between human behaviour and technology design. This research incorporates a focus on the effective technological support of different human activities across different technologies (Mobile, AR, VR, AI, hybrid systems) as well as different environments (IOT/IOE, CPSS’s) and application domains (digital health, e-government, citizen engagement and rural digitisation). She has reviewed and published papers in diverse international conferences and journals, is chair of the NUI Galway Human Centred Design SIG and is currently a collaborator on national and EU projects in the digital health and citizen engagement domains.
Sean O’Riain
Seán O’ Riain has worked in IT across MNC, government and 3rd Level Research sectors in the areas of data Innovation, digital transformation, business analytics, BIS, and semantic enhancement. Sean has a Ph.D. in Informatics from the National University of Ireland, Galway and currently works at Fidelity Investments, a financial services provider.
Andy Donald
I am a Reasercher with the Knowledge Discovery Unit@NUIG working primarily on the SSIX project (https://ssix-project.eu/). I have previously graduated from DCU with a BSc in Computer Applications and a MSc in Bioinformatics in 2004.
I have an extensive background working for a number of small to large private companies including Oracle, Pacemetrics and Datalex. My most recent role involved working as a development manager for a large team focussed on Product architecture based improvements around API first principles for Datalex. My main emphasis was to allow a growing company to be able to scale their software and core services to deploy to larger customers in a quicker and easier fashion. This meant a large focus on the re-architecturing of the legacy software to handle large amounts of data/transactions and allowing this API to be open and approachable to any client, be it an single app developer or a large software development team with a multinational airline.